// projects / energy management
Proprietary ProductReal-time energy monitoring and demand management for small and medium enterprises — built by Kumari Engineering, designed for South Tamil Nadu's industries.
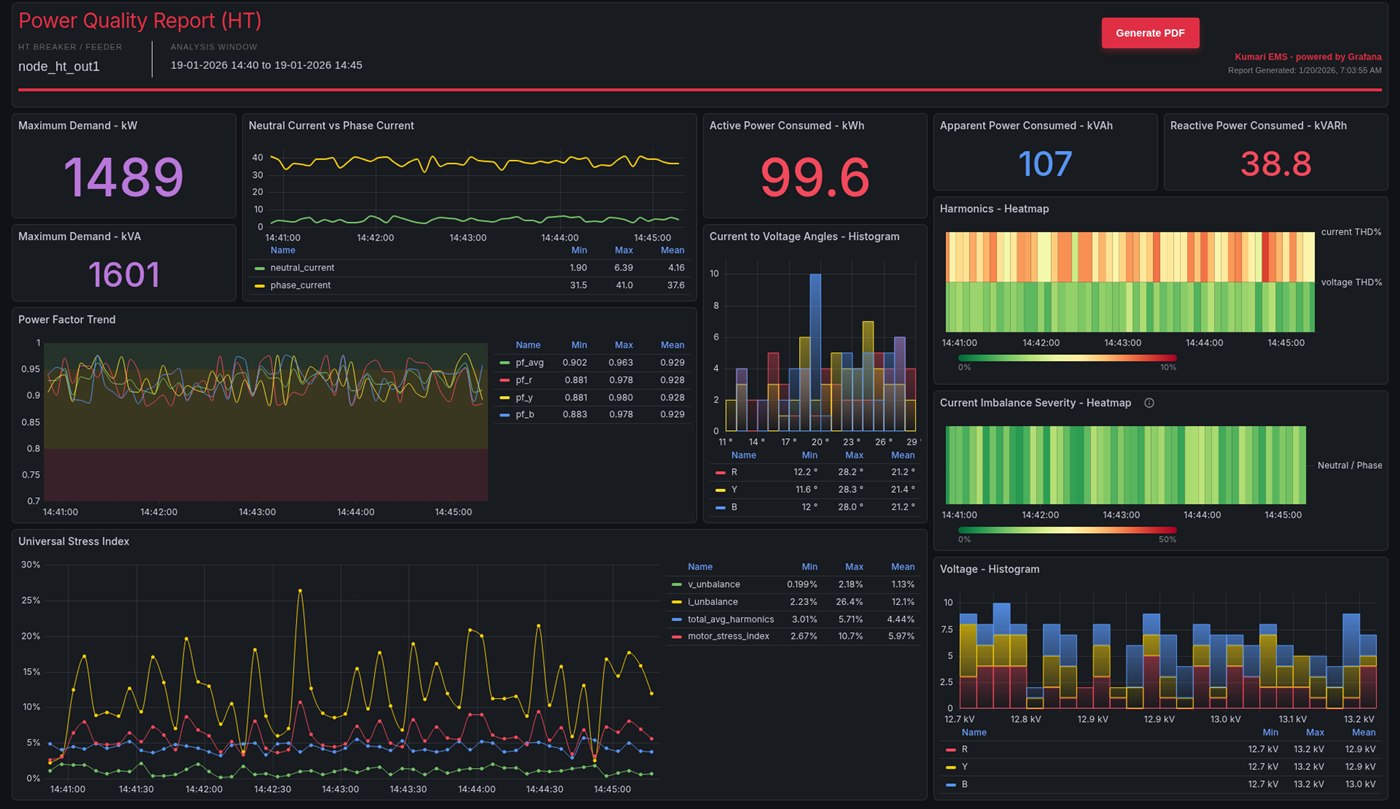
KUMARI EMS DASHBOARD — LIVE kWh, DEMAND TREND & FEEDER-WISE LOAD DISTRIBUTION
// the_problem_we_built_for
Most small and medium manufacturers in South Tamil Nadu know their monthly electricity bill but have no visibility into where that energy actually goes — which machine, which shift, which feeder. Without that data, energy-saving decisions are guesswork: you don't know whether to upgrade the compressor, fix the power factor, or simply train the night shift to switch off idle equipment. Enterprise-grade SCADA and BMS solutions exist, but they require expensive servers, licensed SCADA software, dedicated IT support and months of integration work — none of which is realistic for a 50-employee factory.
Kumari EMS is our answer: a compact, self-contained energy monitoring system that connects to your existing energy meters via Modbus, runs on an industrial edge device on your factory floor, and presents live and historical energy data on a web dashboard accessible from any browser on your local network — no cloud subscription, no IT team, no SCADA licence. We size the system to your feeder count, install and commission it in a single day, and provide local support from our offices in Nagercoil and Tirunelveli.
// what_it_does
Live kW, kVAR, kVA, voltage, current, frequency and power factor readings from every connected energy meter and feeder — updated every few seconds on the dashboard.
The system continuously tracks your maximum demand against your sanctioned limit and sends an alert (on-screen and via SMS/buzzer) before you breach the threshold — giving you time to shed non-critical loads and avoid MD penalty charges.
See exactly how much energy each feeder, machine group or department consumes — in real time and historically. Identify your top energy consumers and size energy-saving projects with data, not guesswork.
Hourly, daily, weekly and monthly energy trend charts and exportable reports are built in. Compare shift-wise consumption, track progress of energy-saving initiatives and produce data for ISO 50001 audits.
Kumari EMS runs entirely on an edge device on your premises. Your energy data stays on your network. There is no recurring cloud fee, no internet dependency for day-to-day operation, and no vendor lock-in.
Our engineers install, wire, configure and commission the system at your site. Ongoing support, calibration and additions (new meters, new feeders) are handled by our local team — same-day response across South Tamil Nadu, with offices in Nagercoil and Tirunelveli.
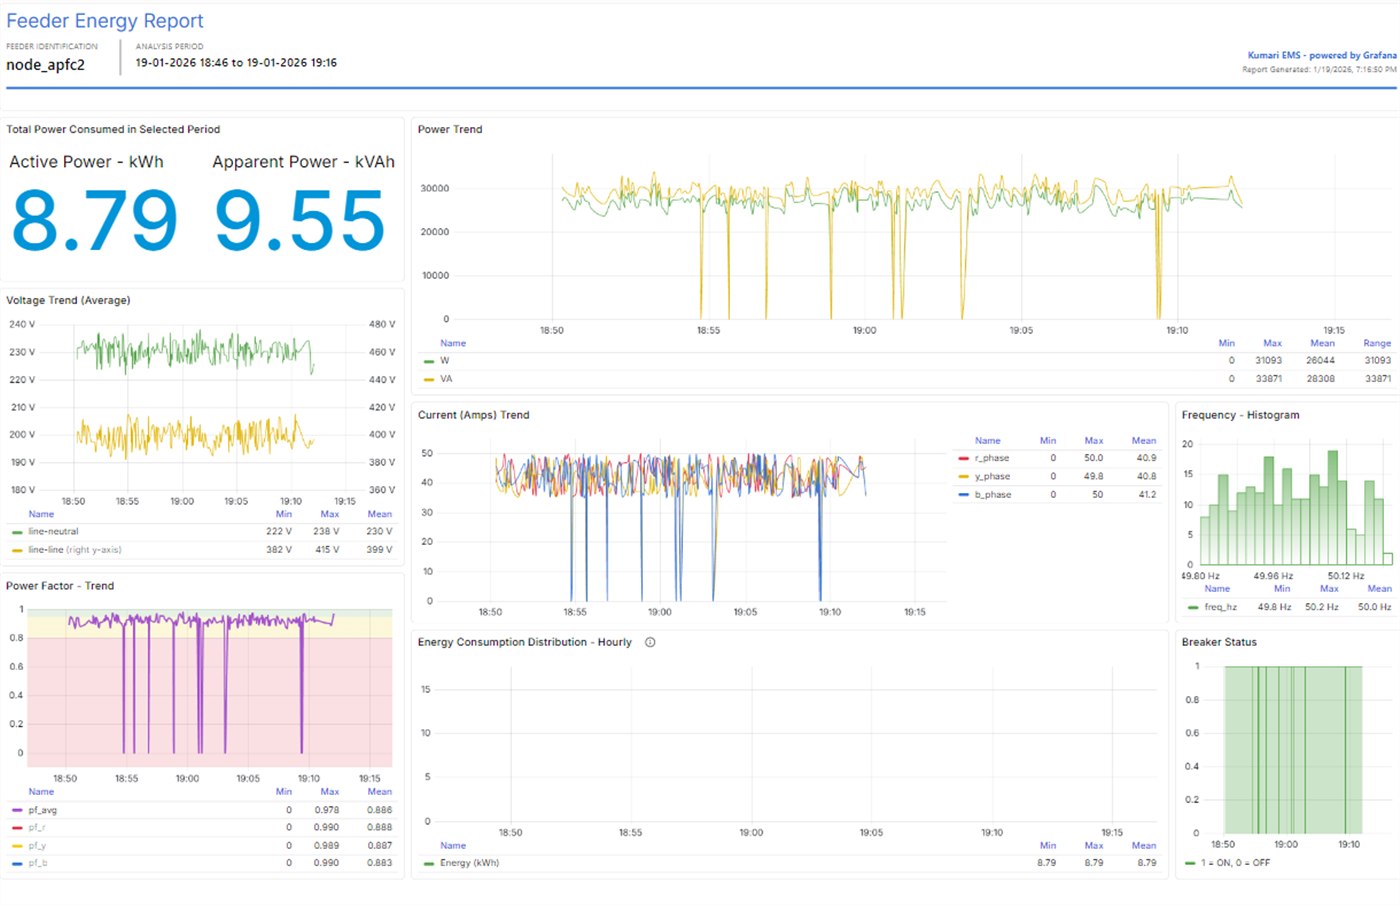
KUMARI EMS TRENDS — 24-HOUR DEMAND PROFILE & PER-FEEDER ENERGY LOG
// who_it_is_for
Kumari EMS is sized for factories and commercial facilities with an HT or LT connection above 50 kVA — the segment where maximum demand penalties and poor power factor surcharges have a material impact on the electricity bill, but where a full enterprise SCADA implementation is not justified. Typical customers include textile mills, rice mills, granite processing units, cold storage facilities, light engineering workshops, hospital complexes and commercial buildings.
If you have received a maximum demand penalty in the last six months, or if you suspect energy is being wasted on your floor but lack the data to act on it, Kumari EMS will give you that visibility — usually paying for itself within the first billing cycle of active demand management.
// technology
Ready to see where your energy goes?We'll assess your meter count, feeder layout and sanctioned demand — and give you a same-day proposal.